Topcis
- Exploring Data
- Data sets contain information about individuals (such as people, animals, or things)
- Each individual contains variables that describe them (height, gender, eye color)
- Variables are categorical if it has a label (gender, hair color, age range)
- Variables are quantitative if it has a numerical value (weight, age, height)
- Analyzing Categorical Data
- A distribution of a categorical variable can tell you the frequency (100/500 people have brown hair) or the relative frequency (20% of people have brown hair)
- Pie charts and bar graphs can display the distribution of a categorical variable.
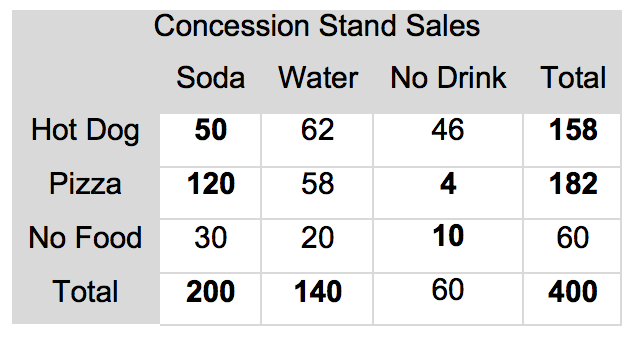
- A two way table organizes data about two categorical variables for the same individuals.
- The marginal distribution is one of the categorical variables over the total number of individuals. It looks at a single variable
- The conditional distribution compares the value of one variable to the value of another
- A segmented bar graph or a side by side bar graph can be used to display conditional distributions
- Displaying Quantitative Data with Graphs
- dotplots, stemplots, and histograms show the distribution of a quantitative variable
- Shape, center, and spread describes the overall pattern.
- Outliers shows departures from the pattern.
- Some distributions are symmetric, left-skewed, or right-skewed
- Describing Quantitative Data with Numbers
- The mean and median describe the center of a distribution.
- The standard deviation and IQR are measures of spread
- The mean and standard deviation should only be used with roughly symmetric distributions
Formulas
\LARGE
\bar{x}=\frac{\sum x_i}{n}
\\[20pt]
\LARGE
S_x=\sqrt{\frac{\sum (x_i-\bar{x})^2}{n-1}}
\\[35pt]
\LARGE
IQR = Q_3 - Q_1
\\[20pt]
\LARGE
\text{outlier} = Q_{-1/+3} \pm (1.5*IQR)
Terms
Review
- If a distribution is skewed, which measure of center should be used?
- A) Mean
- B) Median
- C) Standard deviation
- D) IQR
- A variable measures the income of over 10,000 individual. Which chart should be used to display the data?
- A) Bar graph
- B) Pie chart
- C) Histogram
- D) Stemplot
- Bill Gates wants to find the outliers of unusually large donations received in a charity event. Unfortunetly, he has a concussion and can't remember how. Which formula should he use?
- A) Q_1-1.5 \cdot IQR
- B) Q_1+1.5 \cdot IQR
- C) Q_3-1.5 \cdot IQR
- D) Q_3+1.5 \cdot IQR
- Given the following set of data, find S_{age} (round to the nearest hundreth)
-
Age 12, 23, 52, 92, 7, 41, 78, 39, 63, 19
-
- What is the marginal distribution of soda? (enter as a un-reduced fraction)